Measuring Impact of Emotional Design, Experiment on a Website
Nicolas Esposito (Gobelins Paris)
Morgane Lesné (Aix-Marseille Université)
Jonathan Redet (Human Design Group)
Short research report from the Lutin-Gobelins ErgoDesign Laboratory (Gobelins Paris), October 2017
Abstract
Emotional design provides a framework and principles for encouraging a design that appeals to users’ emotions. The impact on the user experience can be very positive. But the application of a principle does not guarantee that its potential effects will be achieved. This raises questions about how to measure the impact of emotional design and how to master its principles better. We conducted an experiment using two versions of a website: one particularly sober and the other implementing principles in emotional design. After a journey combining two types of pages and the Norman’s three levels of design, participants were invited, for each page, to share their emotions orally and using the Self-Assessment Manikin. The first hypothesis was broadly confirmed: pages with emotional design intentions generated higher emotions. The second hypothesis was also confirmed: different types of emotions were observed depending on the level of design. We were also confronted with the fact that, for a page that aroused mainly two consecutive emotions, the potential effects were not achieved. We have thus made progress in understanding emotional design in terms of measuring its impact and achieving the desired effects.
1. Introduction
Emotional design principles are being used more and more, for example in Web design (Walter, 2011). Currently, their successful application relies heavily on the experience of designers. The principles in question offer no guarantee of the effects they can produce, even if they are the subject of study (Plass et al., 2014). The outcome can vary depending on many factors, including the nature of the designed object, the context, and the users. To deepen our understanding of emotional design, we therefore need to ask how we can measure its impact and how we can further master its principles. With this in mind, we conducted an experiment based on the measurement of emotions and certain principles of emotional design, which we positioned in relation to Norman’s (2004) three levels of design: visceral design, behavioral design, and reflective design. Participants browsed a website where some pages were particularly neutral and others were designed using emotional design principles. Two hypotheses were tested: the first concerned participants’ emotional feelings, which would be more pronounced on pages using these principles. The second hypothesis concerned the type of emotional feeling, which would vary according to the level of design implemented.
Emotion is assessed on the basis of its manifestations as observable by the individual experiencing it, by an outside observer, or via capture and measurement tools. These manifestations are what the affective sciences literature calls components of emotion, which are characterized by the way emotion affects the individual (Moors, 2017). The three components most studied from an emotion assessment perspective are the impact of emotion on autonomic nervous system activity, on expressions, and on subjective experience (Scherer, 2005). These are the same components studied in human-machine interaction (Laurans et al., 2009). Autonomic nervous system activity is studied using tools for capturing physiological activity, with electrodermal response (Sequeira et al., 2009) and heart rate variation (Shalini & Vanitha, 2013) being the main indices measured. As far as the expressive component is concerned, facial expressions are studied the most, mainly by examining facial muscle movements using the Facial Action Coding System (Ekman & Friesen, 1978) or derived methods (Coan & Gottman, 2007). These are the two families of tools considered to be objective, as they offer direct measurements on components. A third family of tools is based on the experiential component: subjective measurement tools such as interview methods and questionnaires. Within this family of tools, several efforts are focusing on pictorial questionnaires, particularly for human-machine interactions (Huisman et al., 2013). In parallel, questionnaires that adopt a classic label-based approach are still being developed today (Harmon-Jones et al., 2016). The choice between these tools is complex and is not motivated solely by objectives of data reliability and validity. As their application to HMI issues often requires moving out of the laboratory, field constraints influence the choice of tools (Redet et al., 2016). Furthermore, the literature acknowledges that these tools, taken alone, do not offer an effective measure of emotional phenomena, and it is necessary to adopt a multimodal approach, which articulates data from several tools together (Zeng et al., 2009). We have selected two physiological analysis tools and one questionnaire, taking into account the criteria of invasiveness for the user and weight on a test protocol, as well as the need for a multimodal approach.
2. Methodology


Figure 1: Focus on the top of the homepage
(version 1 on the left, version 2 on the right with a mascot and more colors)
We prepared two versions of the same five-page website (for a car-sharing service): a particularly neutral first version and a second version based on the application of emotional design principles. For the second version, there were two pages using principles we related to visceral design: personalization (home page with a mascot and more colors, see figure 1) and visual contrast (visual presentation of the service with more contrasts in color and brightness). There was a page linked to behavioral design, implementing forgiveness (404 error page enriched with a cartoon featuring a character who missed his appointment). And there was a page corresponding to reflexive design, focused on persuasion (presentation of offers with three colored panels rather than a list). In addition, there was a sample page where another type of principle was applied: the grouping of elements for better legibility.
Two groups of 10 participants were invited to consult these five pages in the laboratory, following a defined itinerary based on the objective of obtaining information about the proposed service. Each group switched from one version to the other on each page. The alternation began with version 1 for group 1 and version 2 for group 2. Thus, each of the 20 participants consulted two pages using an emotional design principle: pages 2 and 4 for group 1 and pages 1 and 3 for group 2.
While browsing the website, eye-tracking was performed using an eye bar. This enabled a more detailed understanding of the participants’ feedback. Physiological measurements were also carried out (notably on electrodermal response and heart rate). However, the results were not significant, confirming the conclusions of Lockner and Bonnardel (2014) on the irrelevance of this type of measurement when the user is confronted with a man/machine interface whose content is not itself particularly emotion-generating.
After browsing the website, participants answered an open-ended question about the emotions they had felt, and then used the Self-Assessment Manikin (Bradley & Lang, 1994) to characterize that feeling. Both, for each page. Finally, a short interview allowed us to look back in particular at cases of consecutive emotions for the same page and the dominant emotion in such cases.
3. Results and Discussion
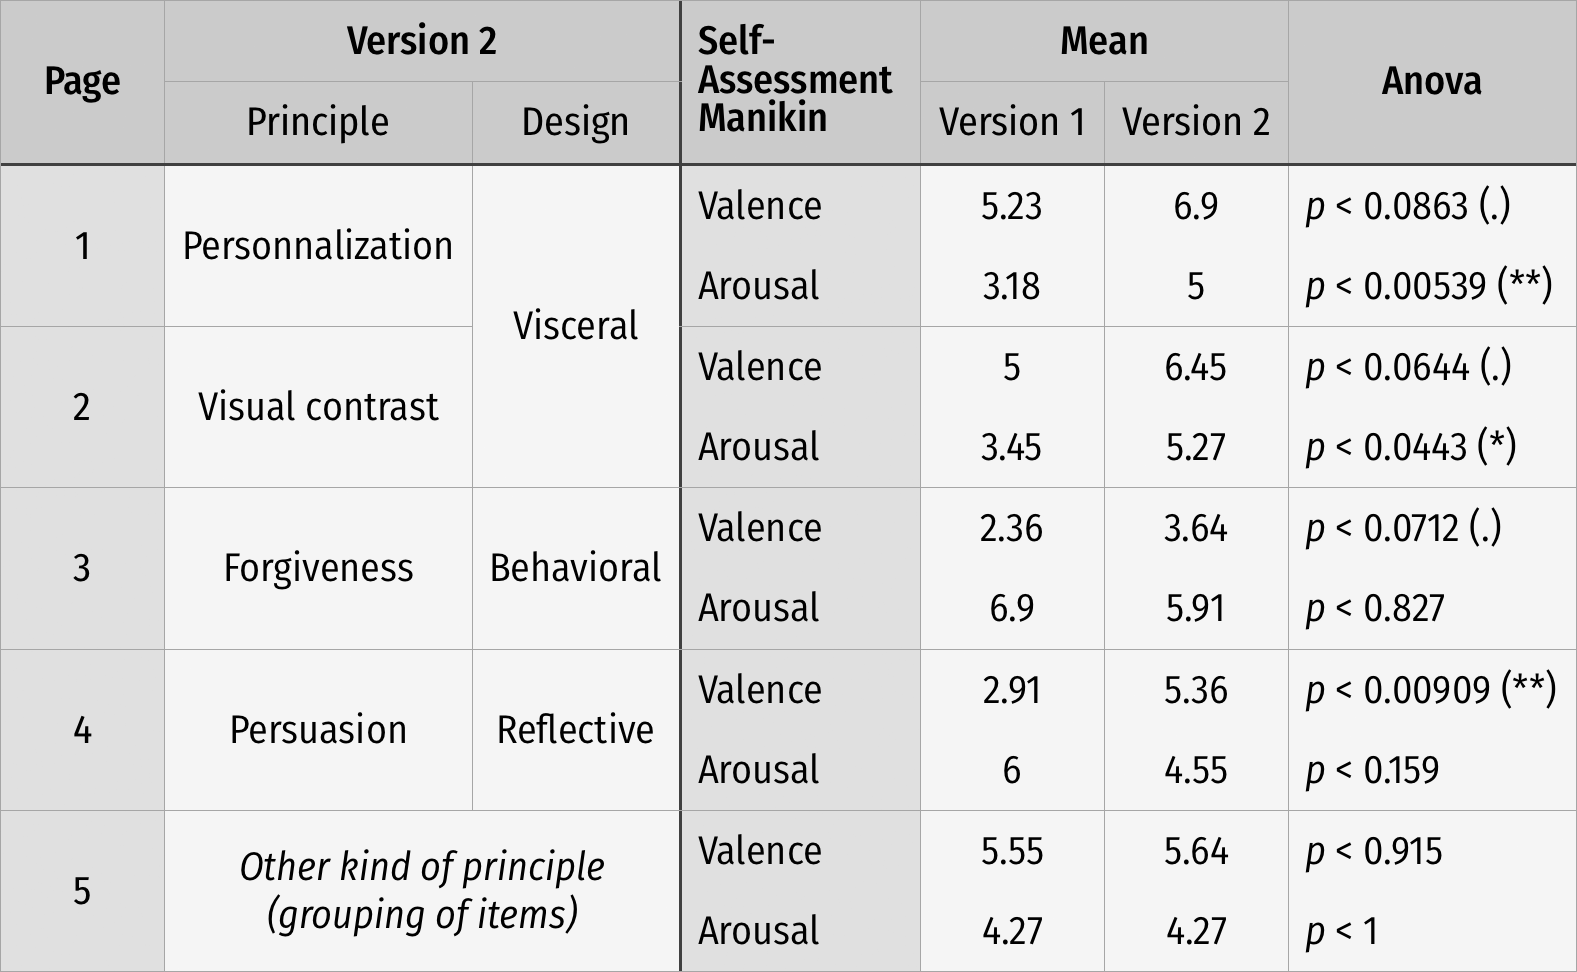
Table 1: Means of responses to Self-Assessment Manikin (between 1 and 9)
The answers to the Self-Assessment Manikin were taken into account for valence and arousal, but not for dominance which is often misunderstood. Table 1 collects the means of these responses for each page and for both versions of the website. Comparisons of these means give rise to Anova tests that allow us to identify significant differences.
As expected, there is no significant difference between the two versions for page 5 (without any particular intent in emotional design). But there is one result that was not expected for page 3: version 2 does not lead to significantly different means. This is a simple error page for version 1 and an error page playing on forgiveness with humour for version 2. While the participants testify to their fun for version 2, their feedback indicates that their negative emotion about the error remains dominant.
The other pages, emotionally simpler, provided the expected results: more pronounced emotions for version 2 with different types of emotions according to the design level. The pages corresponding to visceral and reflective design have resulted in significantly larger means, but with different configurations. Indeed, it is especially the mean of arousal that increases for the two pages concerned by visceral design. While it is especially the mean of arousal that increases for the page concerned by reflective design. These first results globally confirm our two hypotheses. They also highlight the importance of taking into account successive emotions and the predominance of certain emotions. A more extensive study, including consideration of these aspects, is therefore needed to confirm these initial results and to further explore the links between emotional design principles and levels of design.
4. Conclusion
In this article, we have presented results based on the measurement of the impact of emotional design, using mainly subjective feedback from participants (Self-Assessment Manikin and answers to questions). These results were obtained through an experiment based on the pages of a website prepared in two versions: neutral on the one hand, and using principles of emotional design on the other hand. They globally validated our hypotheses: more pronounced emotions regarding the application of these principles, as well as a link between the levels of design (according to Norman) and the types of emotions obtained. This increases our understanding of emotional design and opens the way for further work to explore the questions raised in this study, particularly on the relationship between levels of design and types of emotions, on taking into account the emotional journey, and on the notion of dominant emotion.
5. Références
- Bradley, M. M. & Lang, P. J. (1994). Measuring Emotion: The Self-Assessment Manikin and the Semantic Differential. Journal of Behavior Therapy and Experimental Psychiatry, 25(1), 49–59.
- Coan, J. A. & Gottman, J. M. (2007). The Specific Affect Coding System (SPAFF). In Handbook of Emotion Elicitation and Assessment, 267–285.
- Ekman, P. & Friesen, W. V. (1978). Facial Action Coding System. Environmental Psychology & Nonverbal Behavior.
- Harmon-Jones, C., Bastian, B. & Harmon-Jones, E. (2016). The Discrete Emotions Questionnaire: A New Tool for Measuring State Self-Reported Emotions. PLoS One, 11(8), 1–25.
- Huisman, G., van Hout, M., Dijk, E., van der Geest, T. & Heylen, D. (2013). LEMtool: measuring emotions in visual interfaces. In Proceedings of the SIGCHI Conference on Human Factors in Computing Systems, 351–360.
- Laurans, G., Desmet, P. M. & Hekkert, P. (2009). Assessing Emotion in Interaction: Some Problems and a New Approach. In Proceedings of the 4th International Conference on Designing Pleasurable Products and Interfaces, DPPI (Vol. 9)
- Lockner, D. & Bonnardel, N. (2014). Emotion and Interface Design: How to Measure Interface Design Emotional Effect? Proceedings of the 5th Kanesi Engineering and Emotion Research (KEER 2014). Linköping (Sweden), June 11–13. Linköping University Electronic Press, 51–69.
- Moors, A. (2017). Integration of Two Skeptical Emotion Theories: Dimensional Appraisal Theory and Russell’s Psychological Construction Theory. Psychological Inquiry, 28(1), 1–19.
- Norman, D. A. (2004). Emotional Design: Why We Love (or Hate) Everyday Things. Basic Books.
- Plass, J. L., Heidig, S., Hayward, E. O., Homer, B. D. & Um, E. (2014). Emotional Design in Multimedia Learning: Effects of Shape and Color on Affect and Learning. Learning and Instruction, 29, 128–140.
- Redet, J., Esposito, N., Vian, M. & Tijus, C. (2016). Comparaison d’outils adaptés au terrain pour l’évaluation du ressenti à l’usage des IHM. Actes de Ergo’IA 2016 (Conférence internationale en ergonomie et informatique avancée). Bidart-Biarritz (France), 6–8 juillet.
- Scherer, K. R. (2005). What Are Emotions? And How Can They Be Measured? Social Science Information, 44(4), 695–729.
- Sequeira, H., Hot, P., Silvert, L. & Delplanque, S. (2009). Electrical Autonomic Correlates of Emotion. International Journal of Psychophysiology, 71(1), 50–56.
- Shalini, B. & Vanitha, L. (2013). Emotion Detection in Human Beings Using ECG Signals. International Journal of Engineering Trends and Technology (IJETT), 4(5), 1337–1342.
- Walter, A. (2011). Designing for Emotion. A Book Apart.
- Zeng, Z., Pantic, M., Roisman, G. I. & Huang, T. S. (2009). A Survey of Affect Recognition Methods: Audio, Visual, and Spontaneous Expressions. IEEE Transactions on Pattern Analysis and Machine Intelligence, 31(1), 39–58.